
Lean comparison to start strong
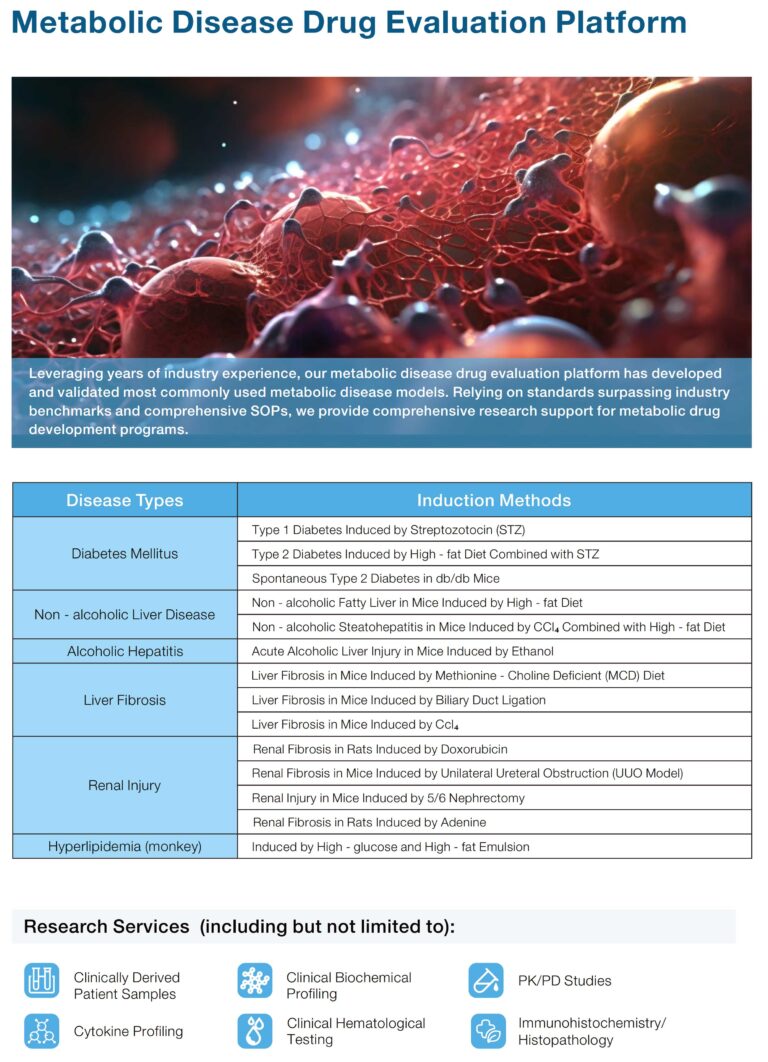
Pick the right model like you pick a training plan—efficient, targeted, and measurable. Comparing viral-model workflows to metabolic systems clears the clutter. In early design you decide between tight-control viral vectors and the complexity of diet-induced or genetic metabolic disease models; the first gives speed, the latter gives translational depth. Use metabolic disease models as the benchmark when your aim is metabolic endpoints, since they capture physiology—insulin resistance, steatosis, and altered pharmacokinetics—better than most acute infection systems. CDC data anchor this need: more than 34 million Americans live with diabetes, so translational relevance matters now.
Head-to-head: what each model delivers
Viral models: fast, high signal, useful for mechanism, and excellent for vector validation. They shine when you need reproducible injury or expression in a short timeframe. But they often miss chronic metabolic adaptations and long-term biomarker dynamics.
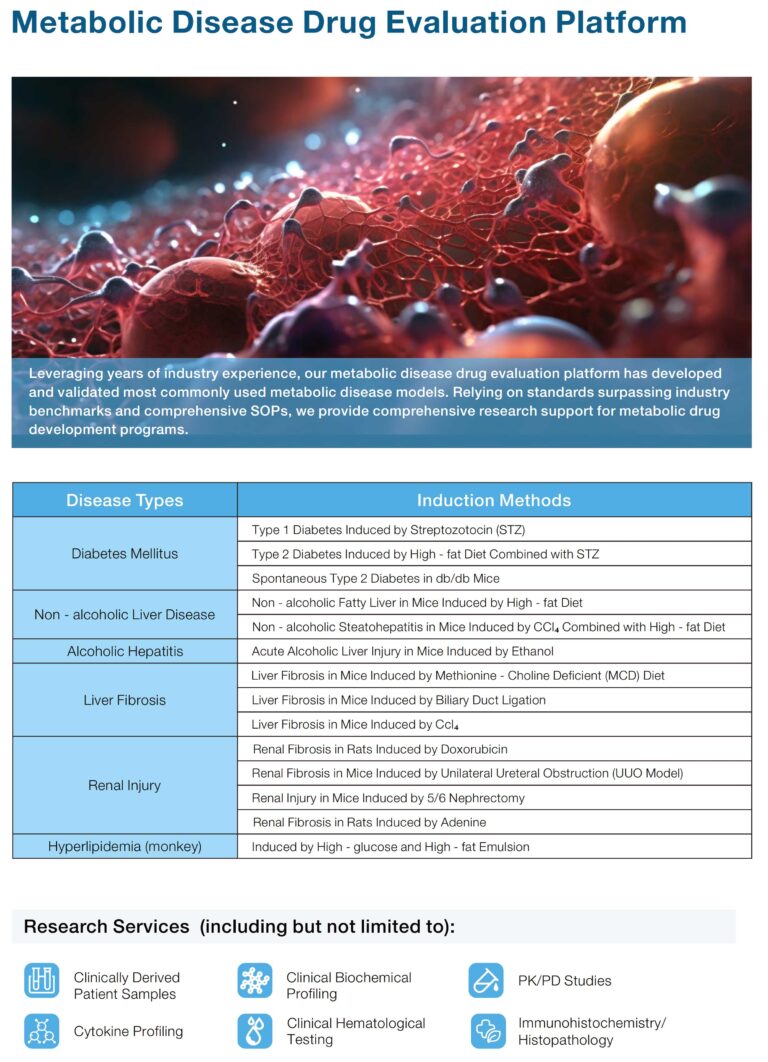
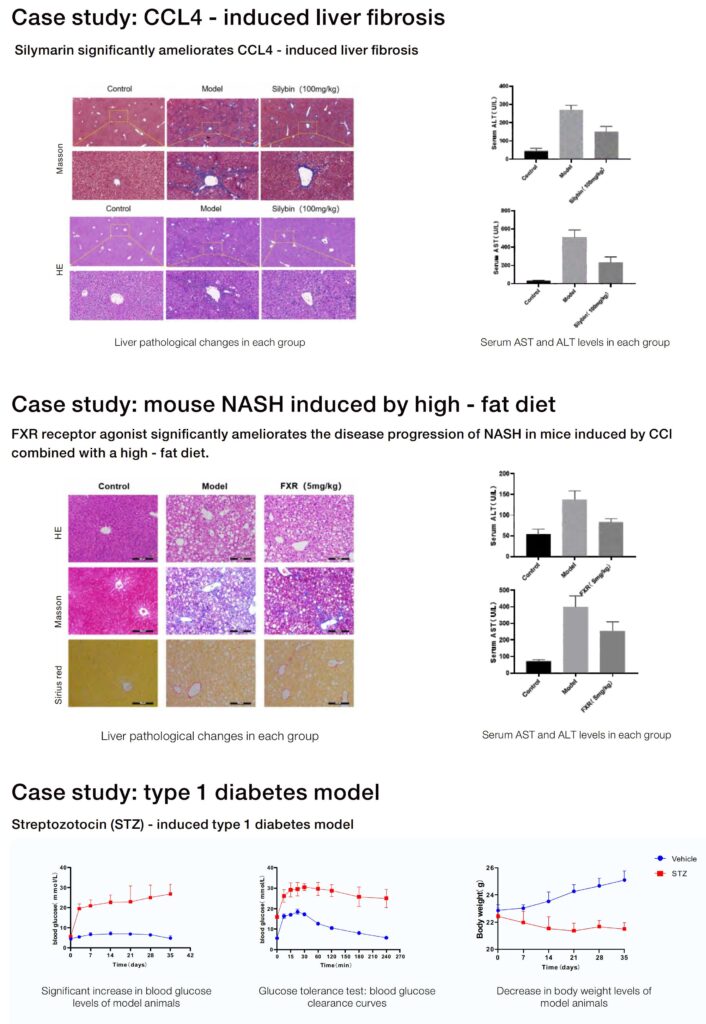
Metabolic systems: slower to establish but richer on endpoints. Rodent models—diet-induced, transgenic mouse strains, or chemical induction—reveal compensatory physiology, cumulative toxicity, and real glucose-insulin dynamics measured by glucose tolerance test. You trade rapidity for translational fidelity.
Design levers that change outcomes
Control sample timing. Align study windows with when pathology is most discriminative. Balance cohort size against expected effect size—small groups hide variability; oversized cohorts waste resources. Standardize cage conditions and diet formulations to reduce noise. Add a pharmacokinetics arm when drug exposure will influence metabolic phenotype; a one-time PK check often prevents misinterpretation later.
Common mistakes teams keep repeating
Relying on single-endpoint readouts. Picking only one biomarker—say fasting glucose—misses compensations in insulin signaling or lipid handling. Confusing acute inflammation signals for chronic metabolic change leads to false positives. And skipping baseline metabolic phenotyping before intervention ruins interpretability—don’t do it.
Operational teardown: aligning goals, assays, and models
Start with the hypothesis. Then map assays to mechanism: histology for steatosis, glucose tolerance tests for systemic function, targeted biomarker panels for pathway engagement. Combine a dose-response PK arm with metabolic readouts so exposure-effect relationships are clear. For transparency, document randomization and blinding steps in the protocol. Operationally, integrate {main_keyword} and {variation_keyword} into the production teardown so stakeholders read the same plan.
When to iterate and when to pivot
Iterate if effect directions are consistent but noisy—tighten endpoints, increase sampling frequency, or add a biomarker panel. Pivot when the model fails to reproduce the physiology you targeted—switch from an acute viral injury model to a chronic metabolic model, or vice versa. Small pilots cut wasted time; run a 2–3 week feasibility with clear go/no-go criteria before full deployment.
Comparing costs, timelines, and translational yield
Viral work often costs less up-front and completes sooner. Metabolic disease modelling typically requires longer housing, dietary manipulation, and more assays—higher cost, higher yield. Quantify yield as effect size on translational endpoints: biomarker change, histopathology score, and functional readout. Use those metrics to compare models objectively.
Golden rules for selecting the right approach
1) Match model complexity to decision risk: high-risk decisions need metabolic fidelity. 2) Measure exposure: include pharmacokinetics to tie dose to effect. 3) Use at least two orthogonal endpoints—physiology plus histology or biomarker—to confirm findings.
Closing advisory — three critical evaluation metrics
Metric 1: Translational concordance—how closely do model endpoints map to human disease biomarkers and functional outcomes? Metric 2: Effect reproducibility—are results stable across cohorts, diets, and timepoints? Metric 3: Exposure–response clarity—does the pharmacokinetic profile explain the observed effect size? Apply these metrics early and often; they turn guesses into defensible decisions.
Final line: Trust disciplined design and rigorous comparison—Jennio Biotech is built to bridge model fidelity and program speed. —